Printable Graph Paper
Graphs, and the paper used to create them, are centuries-old tools most people probably used in high school math, and haven’t given a thought since. But did you know that graphs changed the world? It may sound cheesy – but it’s true!
The purpose of this article isn’t to dredge up bad memories of high school math. Rather, it’s to show that graphs aren’t as bad as you might remember and that maybe – just maybe – you will end up wanting to use them to change your world. Or possibly just to have a laugh.
The Five W’s of Graph Paper
What Is Graph Paper?
Graph paper is a predesigned paper format with structured lines and shapes to help create graphs, tables, diagrams and artwork. It allows you to be creative using its equally spaced geometries as guidelines, and it makes information easier to see.
Here are some occupations that use graphs regularly:
- Scientists – to simplify their data
- Businessmen – to sell their points
- Engineers – to finalize their results
- Politicians – to help argue their case
- Artists – to structure their work
The list could go on. And on. And on. I think it’s safe to say that everyone – whether they want to admit it or not – needs graphs and graph paper in their day-to-day lives. They do everything from simplifying information to helping people breathe their creativity. There are no set rules for what graph paper should be used for. Creating music, writing poetry, and designing the background of video games are just a few ways that graph paper has probably affected your life, without your even knowing it!
Defining a Graph
The graph is a visual representation of information, typically showing the relationship between two sets of data. Hence, graph paper is the tool that will most easily enable you to make and format the graph.
Graphs can be:
- Linear
- Circular
- Rectangular
- Tabular
- Triangular
There are over 50 types of graphs. Many of them you probably already know about, even if you don’t want to think about them. Some of the more common graphs include bar graphs, pie charts, scatter plots, venn diagrams, line graphs, and are-you-bored graphs. I’m kidding. Hopefully you’re not bored! But if you thought you were, then let me say that graphs are also memes!
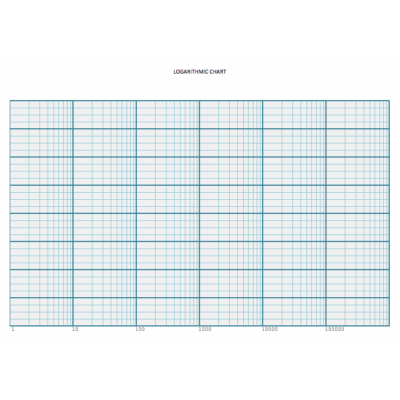
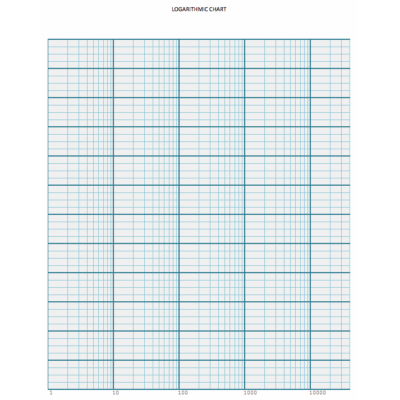
Two types of graphs that are extremely useful but that most people don’t think about while eating their cereal or folding their laundry are logarithmic graphs and polar graphs.
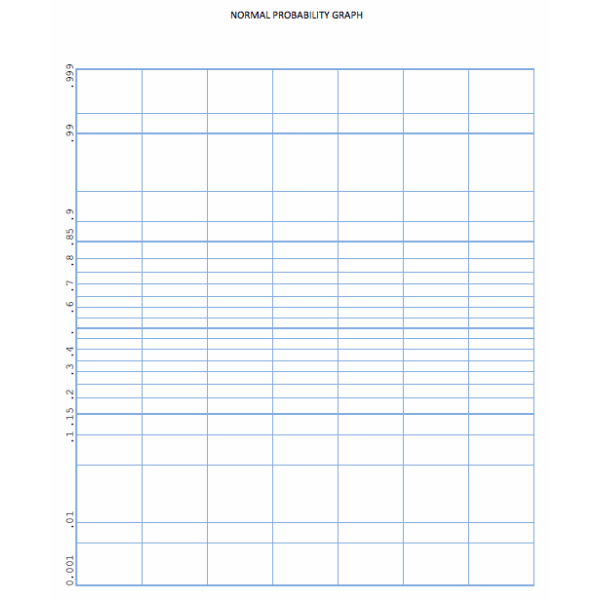
A logarithmic graph is not only an awesome name for a university-based band – The Log-a-Rhythms. It’s also a useful graph for big numbers. Logarithmic graphs allow you to fit numbers that would be too high for a normal graph. It does this by shrinking the numbers with a mathematical (log) function. This will fit the data on a normal plot, in the manner you can see below.

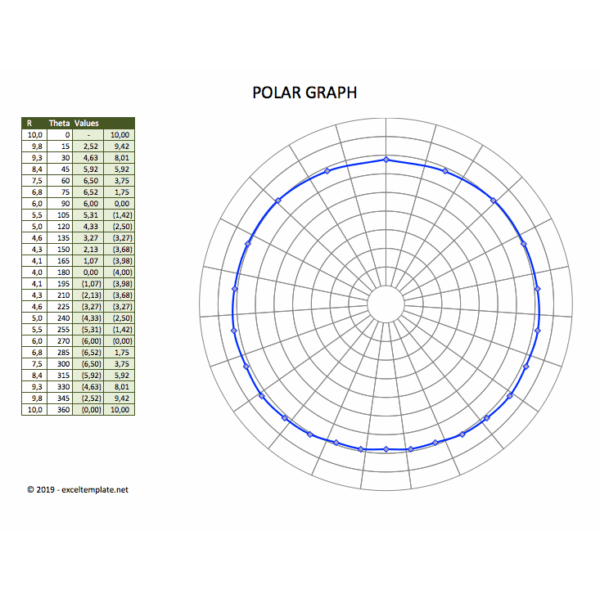
A polar graph is another way to fit otherwise difficult concepts onto a flat piece of paper. For example. Let’s say you’re the kind of cool guy who likes to go to clubs and hit the dance floor and impress people with your mad yo-yo skills. Well, if these club-goers find that kind of thing impressive, imagine how much more impressed they’ll be when you pony up to the bar with a sheet of crazy-circular graph paper, and show them you can plot your yo-yo moves! And if that was something you chose to do, then the right graph for you to use would be a polar graph, which would allow you to graph the data in radial coordinates around a circle in terms of angle and distance from the origin. The origin, in this case, would be the finger the yo-yo is attached to. The distance would be how far it moves along its string while you, the center of attention, show off your sweet, sweet moves.

Other than yo-yo masters planning their next move, these graphs are also used by scientists to help visually understand circular motion. They also help engineers and physicians calculate data.
The best use of graphs is, perhaps, when experts use them to simplify complex information, so that non-experts can be a part of the conversation. Think of Twitter, Facebook, Linkedin, ESPN, etc. All of these media outlets like to keep people interested, and one way they do that is by showing graphs as much as possible to make information seem simple, fun, worthy of going viral… I think you get the picture (but I think you’d get the picture even more clearly if we made it into a graph!).
Types of Graph Paper
There are many types of graph paper that can be used depending on the task at hand. The main types of graph paper that we offer are based on these three systems:
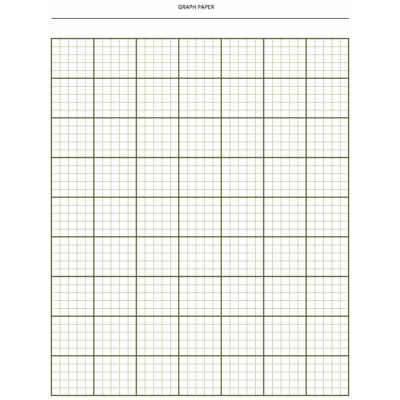
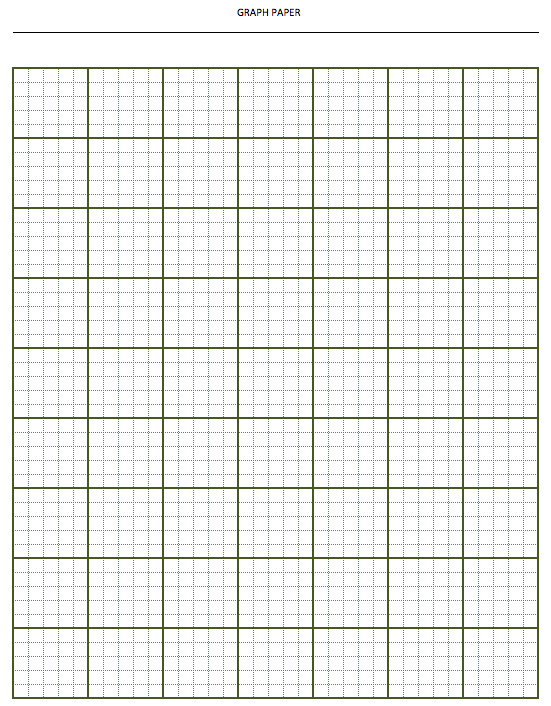
- Cartesian coordinates (linear grid-like patterns)
- Hexagonal geometries (six sided figures)
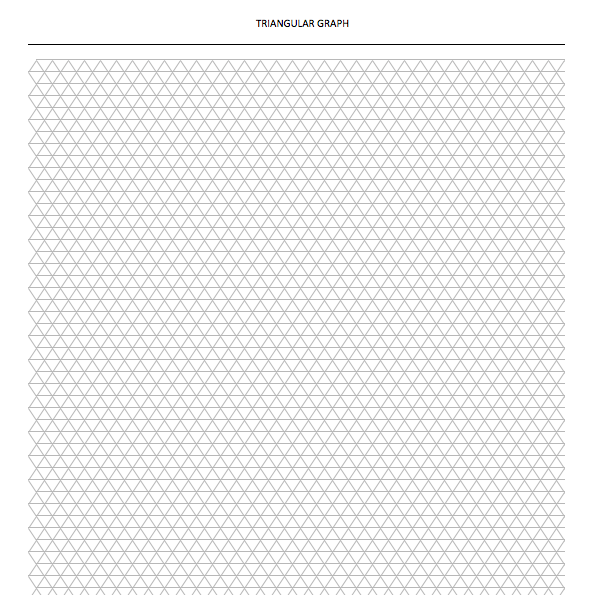
- Isometric triangles
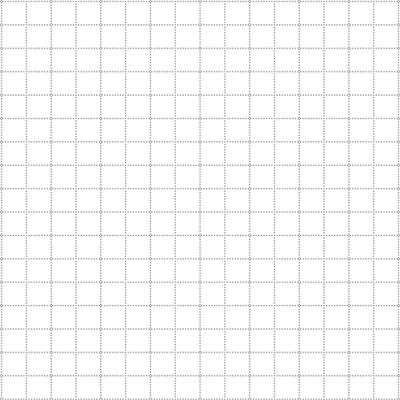


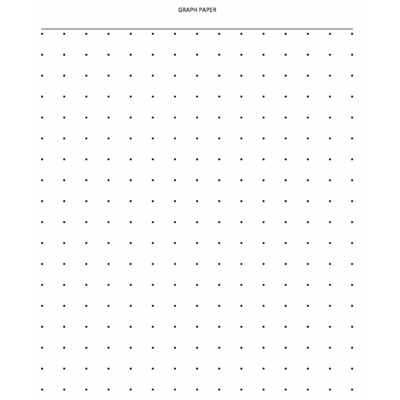
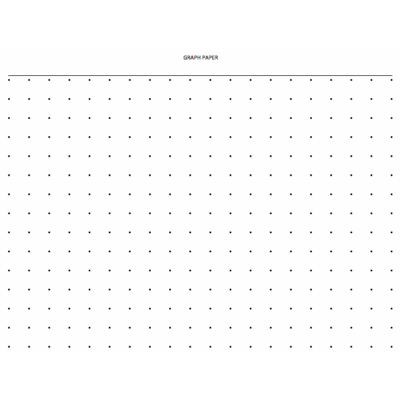
We also have templates with the Cartesian coordinate system using dots instead of lines. The dots are less noticeable background features, but still give you the ability to use the structured network as a guideline.

Deciding Which Graph Paper or Graph to Use
There are different benefits to each of these styles of graph paper.
Figuring out which you need for a given task depends on the desired outcome of the work.
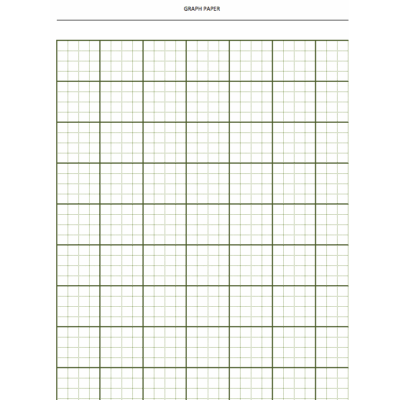
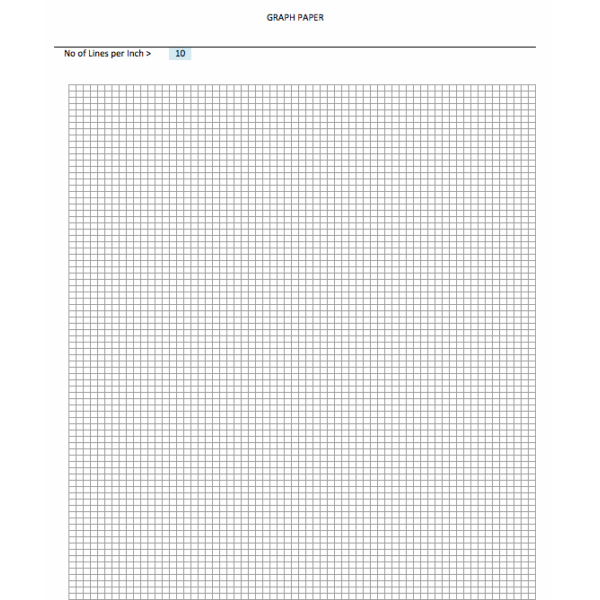
Cartesian coordinate paper is the most commonly used form of graph paper. It allows you to very easily create straight lines and equally spaced geometries. Most graphs and tables are made with the Cartesian system.
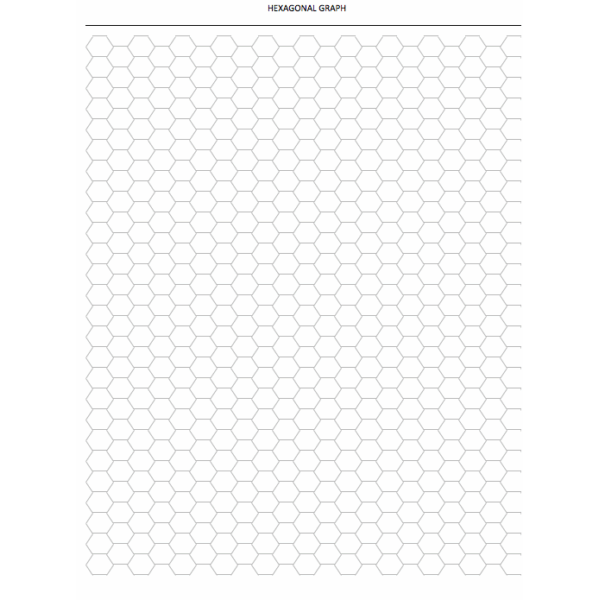
Hexagonal graph paper is, if we’re being honest, probably mostly used by nerds with nothing better to do on a weekend than play tabletop fantasy role-playing games. They are also used, perhaps more productively, in the arts. The most common form of artwork related to the “honeycomb-like” grid is called a tessellation. Such as this one found at this useful art page:

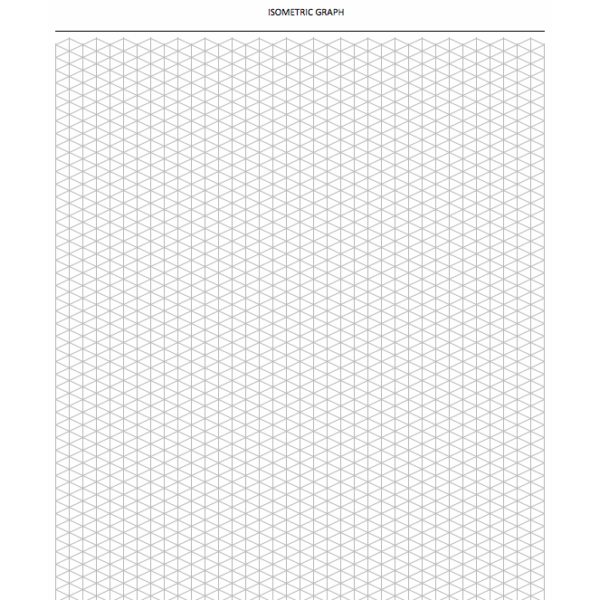
Isometric graph paper is built up of symmetrical triangles. This is used mostly to create three-dimensional features. The three lines of the triangles relate to the height, width and length of the object. Below is a great example of the usefulness of isometric paper:

Fun Facts on Graph Paper
Popular early video games, such as Super Mario, were designed – pixel by pixel – on graph paper!
The board game Settlers of Catan is based off of the hexagonal graph paper geometries.
Any screen – whether it’s a phone, T.V., or computer – based off of the same kind of graph that is used on paper. Each pixel (colored dot) represents a box of the cartesian system.
Early in this article, I mentioned that graph paper changed the world. And I meant it. We are living in the information age, and much of that information is disseminated through graphs, either on graph paper or on a virtual facsimile of graph paper. It is an essential tool that doesn’t just allow scientists, engineers and researchers to do their work efficiently – it helps shape the way they think. Without graph paper, we wouldn’t have iPhones or electric cars and windmills, or Super Mario. And sure, we could live without these things… but that life would be much more boring!

Free Graph Paper Templates


Graph paper templates are prearranged grids that are made to simplify the creative process. They are necessary because creating a grid by hand can be extremely tedious and it is much easier to start a project with the tool of the graph paper as an aid.
Here are some good steps, especially for more data-driven uses, for using graph paper in the most efficient manner:
- Write down all of the key information you wish to show
- Decide which graph style best suits your information
- Choose a style of graph paper and spacing
- Scale the range of data to numbers of cells of the paper
- Outline the graph in pencil on the paper
- Plot your data or points in pencil
- Finish the graph with permanent ink
In terms of using the templates for a more creative approach, steps do not have to be followed in order (or, at all!).
Sometimes your work can be made easier if your information works with a pre-made graph template. Our free excel graph templates are printable, scalable, and easy to download. Most templates come in US Letter paper size. If you need another format – take a look at our graph maker – you can make any graph you want, and use any paper size of your choice.