Chart Templates
There are so many types of graphs and charts to convey your message: pie, bubble, and donut charts, scatter and bubble plots, bar, line, and column charts, gauges… just to name a few common options.
Communicate your data in a easy-to-follow visual way with our free chart templates.
Our easy-to-download digital excel packages are ready to be used – simply download one of the examples below, and use Excel, Numbers, OpenOffice, or Google Sheets to present your data.
Only 2 templates in this category so far – but we are working on adding more. Add your “vote of trust” to 37130 downloads these templates received from users all over the world. Creating graphs and charts have never been easier.

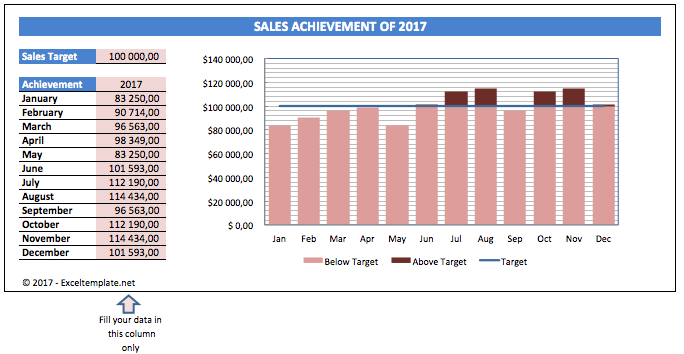
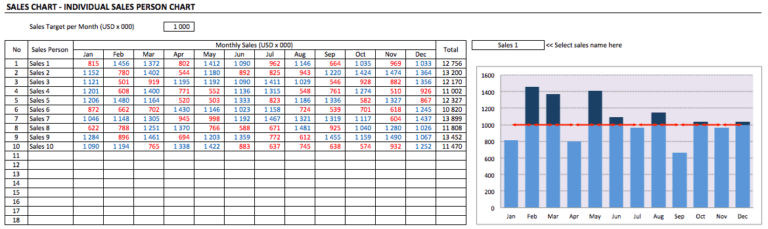
Simple Sales Charts
These are 7 simple sales chart templates with variety of models you can use to map your sales achievement within one year period. You can pick the most suitable one for your purposes. Or, you can use all...
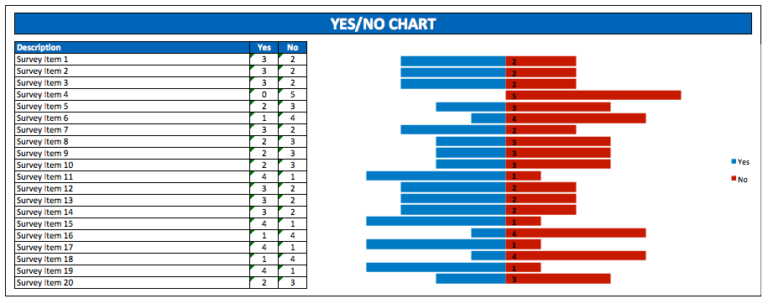
Yes No Survey Chart
If you are working as a researcher or a marketing analyst, sometimes you have to collect datas which consists of "yes" and "no" answers and use it to analyze people behavior in certain areas. Since you...